
Gene set analysis methods based on GSZ and asymptotic p-value
(This is supplementary page for mGSZ.)Description:
mGSZ is a gene set analysis method based on GSZ (Törönen et al.,2009) and asymptotic p-value. mGSZ is different from the standard GSZ method in that it assigns asymptotic p-values to the gene set scores instead of empirical p-values. Asymptotic p-value calculation involves fitting a suitable asymptotic model to the null distribution of gene set scores. Asymptotic p-value calculation requires considerably fewer permutations as compared to the empirical p-value calculation to accurately estimate p-values and thus speeds up the gene set analysis process. In addition, we also present improved versions of GSA (Efron and Tibshirani, 2007) and Allez (Newton et al., 2007), represented as mGSA and mAllez respectively. The improvement in GSA is based on the use of asymptotic p-values and replacement of the max-mean statistics with GSZ statistics. Whereas, the improvement in Allez is based on the use of asymptotic p-values and implementation of both gene and sample permutation.
Manuscript:
Supplementary texts:
Supplementary figures:
- EV: Extreme value distribution
- GEV: General extreme value distribution
- GAMMA: Gamma distribution
- NORM: Gaussian distribution
- EMP: Empirical p-value
- XC: Class specific p-value from 100,000 permutations
- XP: Pooled p-value from 100,000 permutations
- YC: Class specific p-value from 500 permutations
- YP: Pooled p-value from 500 permutations
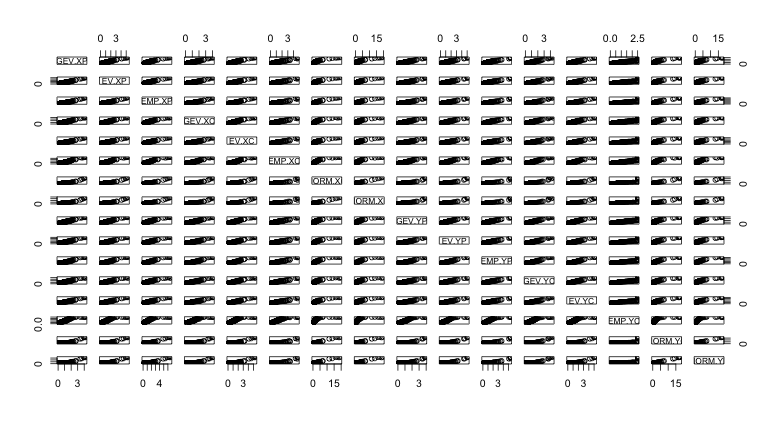
- Suppl. fig. 1 . Pairs plot for different p-values for GSZ scores.
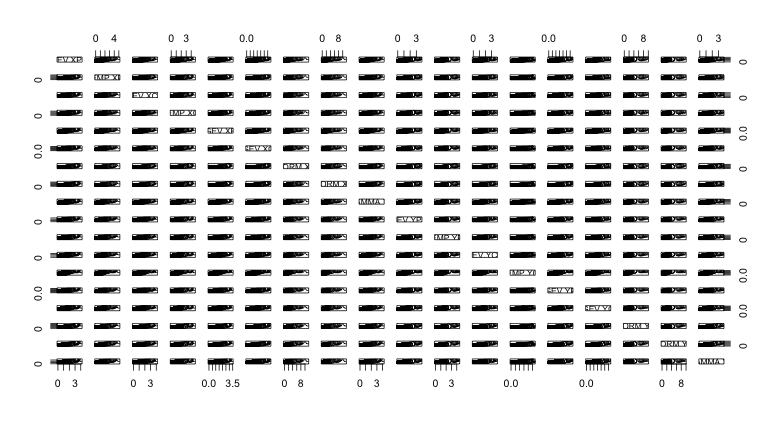
- Suppl. fig. 2 . Pairs plot for different p-values for mGSA scores.
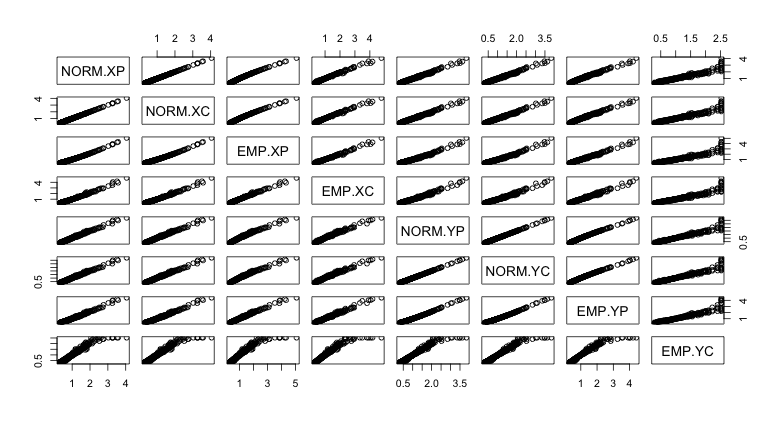
- Suppl. fig. 3 . Pairs plot for different p-values for mAllez scores.
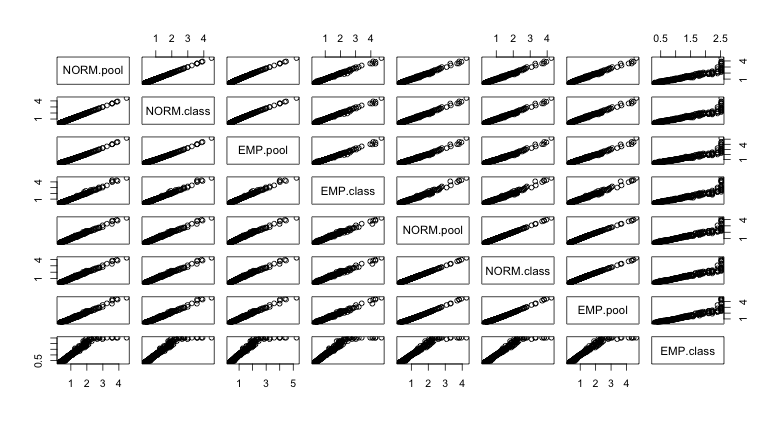
- Suppl. fig. 4 . Pairs plot for different p-values for SUM (method based on sum of scores) scores.
Following are the pairs plot showing correlation of empirical and asymptotic p-values (class specific and pooled) calculated from 500 sample permutations with empirical and asymptotic p-values (class specific and pooled) calculated from 100,000 sample permutations. Abbreviations used in the plots are as follows:
Supplementary data:
- Top gene sets reported by the compared methods from gender dataset (click here).
- Top gene sets reported by the compared methods from p53 dataset (click here).
R package:
mGSZ is an R package that implements our ideas (mGSZ_1.0.tar.gz). In addition to our method, the package also includes 7 other gene set analysis methods discussed in the main article: mGSA, mAllez and methods based on Wilcoxon Rank Sum, Sum of scores, Sum of Squares of scores, Kolmogorov Smirnov and weighted Kolmogorov Smirnov. mGSA and mAllez are improved versions of GSA (Efron and Tibshirani, 2007) and Allez (Newton et al., 2007) respectively.
Demo data for testing can be downloaded from GSEA website .
Example run in R:
library(mGSZ)
#### create gene names ####
gene.names <- paste("g",1:1000, sep = "")
#### create random gene expression data matrix ####
set.seed(100)
expr.data <- matrix(rnorm(1000*50),ncol=50)
rownames(expr.data) <- gene.names
b <- matrix(2*rnorm(2500),ncol=25)
ind <- sample(1:100,replace=FALSE)
expr.data[ind,26:50] <- expr.data[ind,26:50] + b
sample.labels <- rep(1:2,c(25,25))
#### create random gene sets ####
gene.sets <- vector("list", 100)
for(i in 1:length(gene.sets)){
gene.sets[[i]] <- sample(gene.names, size = 20)
}
names(gene.sets) <- paste("set", as.character(1:100), sep="")
mGSZ.obj <- mGSZ(x=expr.data, y=gene.sets, l=sample.labels, p = 100)
top.mGSZ.sets <- toTable(mGSZ.obj, m="mGSZ", n = 10)
#### scoring function profile data across the ordered gene list for the top 5 gene sets ####
data4plot <- StabPlotData(mGSZ.obj,rank.vector=c(1,2,3,4,5))
#### profile plot for the top gene set ####
plotProfile(data4plot,1)
#### gene sets in a gmt format can be converted to mGSZ readable format as follows: ####
#### gene.sets <- geneSetsList("gene.sets.gmt") ####